Tag Archives for " ruby "
N-gram Analysis for Fun and Profit
What would you do if you are given a big collection of text and you want to extract some meaning out of it? A good start is to break up your text into n-grams.
In the fields of computational linguistics and probability, an n-gram is a contiguous sequence of n items from a given sequence of text.
– Wikipedia
For example:
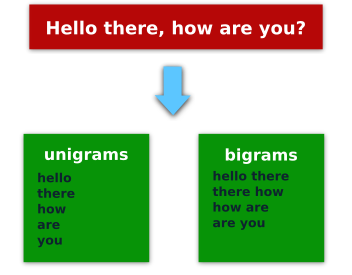
If we take the phrase “Hello there, how are you?” then the unigrams (ngrams of one element) would be: "Hello", "there", "how", "are", "you", and the bigrams (ngrams of two elements): ["Hello", "there"], ["there", "how"], ["how", "are"], ["are", "you"].
If you learn better with images here is a picture of that.
Downloading Sample Data
Before we can get our hands dirty we will need some sample data. If you don’t have any to work with you could download a few Wikipedia or blog articles. In this particular case, I decided to download some IRC logs from #ruby freenode’s channel. The logs can be found here: irclog.whitequark.org/ruby
A note on data formats:
If a plain text version of the resource you want to analyze is not available, then you can use Nokogiri to parse the page and extract the data. In this case, the irc logs are available in plain text by appending .txt at the end of the url so we will take advantage of that.
This class will download and save the data for us:
|
1 2 3 4 5 6 7 8 9 10 11 12 13 14 15 16 17 18 19 20 21 22 23 24 25 26 27 28 29 30 31 32 |
require 'restclient' class LogParser LOG_DIR = 'irc_logs' def initialize(date) @date = date @log_name = "#{LOG_DIR}/irc-log-#{@date}.txt" end def download_page(url) return log_contents if File.exist? @log_name RestClient.get(url).body end def save_page(page) File.open(@log_name, "w+") { |f| f.puts page } end def log_contents File.readlines(@log_name).join end def get_messages page = download_page("http://irclog.whitequark.org/ruby/#{@date}.txt") save_page(page) page end end log = LogParser.new("2015-04-15") msg = log.get_messages |
This is a pretty straightforward class. We use RestClient as our HTTP client and then we save the results in a file so we don’t have to request them multiple times while we make modifications to our program.
Analyzing the data
Now that we have our data we can analyze it. Here is a simple Ngram class. In this class we use the Array#each_cons method which produces the ngrams.
Since this method returns an Enumerator we need to call to_a on it to get an Array.
|
1 2 3 4 5 6 7 8 9 |
class Ngram def initialize(input) @input = input end def ngrams(n) @input.split.each_cons(n).to_a end end |
Then we put everything together using a loop, Hash#merge! and Enumerable#sort_by:
|
1 2 3 4 5 6 7 8 9 10 11 12 13 14 15 |
# Filter words that appear less times than this MIN_REPETITIONS = 20 total = {} # Get the logs for the first 15 days of the month and return the bigrams (1..15).each do |n| day = '%02d' % [n] total.merge!(get_trigrams_for_date "2015-04-#{day}") { |k, old, new| old + new } end # Sort in descending order total = total.sort_by { |k, v| -v }.reject { |k, v| v < MIN_REPETITIONS } total.each { |k, v| puts "#{v} => #{k}" } |
Note: the
get_trigrams_for_datemethod is not here for brevity, but you can find it on github.
This is what the output looks like:
|
1 2 3 4 5 6 7 |
112 => i want to 83 => link for more 82 => is there a 71 => you want to 66 => i don't know 66 => i have a 65 => i need to |
As you can see wanting to do things is very popular in #ruby 
Conclusion
Now it’s your turn, crack open your editor and start playing around with some n-gram analysis. Another way to see n-grams in action is the Google Ngram Viewer.
Natural language processing (NLP) can be a fascinating subject, wikipedia has a good overview of the topic.
You can find the complete code for this post here: https://github.com/matugm/ngram-analysis/blob/master/irc_histogram.rb
Recursion and Memoization in Ruby
Have you ever wondered if there is an alternative to iteration? Well I have good news for you: there is, and it’s called recursion.
Recursive functions are those that keep calling themselves until they hit an end goal (also known as the base case). The idea is that after each function call we make some progress towards this base case, reducing the amount of work left to be done.
Once the base case is reached, that’s the end of the recursion, and the functions start resolving.
Ruby Recursion
A classic example to start learning about recursion is calculating a factorial number, let’s see how we can do this in Ruby using both iteration and recursion.
To calculate the factorial of a number we have to multiply all the numbers from 1 to our target number. For example, the factorial of 5 is: 1 * 2 * 3 * 4 * 5 = 120. Let’s see how we can do this using Ruby and recursion.
Example:
|
1 2 3 4 5 6 7 8 9 10 11 |
def iterative_factorial(n) (1..n).inject(:*) end def recursive_factorial(n) # Base case return 1 if n <= 1 # Recursive call n * recursive_factorial(n-1) end |
In this example I show you two ways to calculate a factorial number. The iterative and the recursive solution.
In the recursive solution we make progress by decreasing the number we are working with (n-1). Once (n <= 1) there are no more recursive calls, and this is what happens:
|
1 2 3 4 5 |
return 1 # recursive_factorial(1) return 2 * 1 # recursive_factorial(2) return 3 * 2 # recursive_factorial(3) return 4 * 6 # recursive_factorial(4) return 5 * 24 # recursive_factorial(5) |
As Ruby developers we go for the iterative solution most of the time, and that’s great, but I think it’s still worth knowing how recursion works. Now let’s see another classic example: fibonacci numbers.
The Fibonacci Sequence
Leonardo Fibonacci discovered this sequence when investigating how to model the growth of rabbit population under ideal conditions. The sequence is calculated by adding up the two numbers that came before the current one.
Example:
1, 1, 2, 3, 5, 8, 13, 21
To calculate this in Ruby you can use a recursive function:
|
1 2 3 4 5 |
def fib(n) return n if n < 2 fib(n-1) + fib(n-2) end |
Using this function and a range you can easily calculate the first 20 Fibonacci numbers.
|
1 |
(1..20).each { |n| puts fib(n) } |
However, there is a problem:
Your function is doing a lot of extra work that it doesn’t need to. To illustrate this, look at the following image.

In the image we can see how fib(3) is calculated five times. This makes your function really slow if you try to calculate longer Fibonacci sequences. The solution? Memoization.
Memoization: Reusing Work We Have Already Done
Wouldn’t it be great if you could just reuse the work you have already done in previous steps? We can do that using memoization.
To save our expensive calculation results we use a cache. In this case, an array will do.
Example:
|
1 2 3 4 5 6 7 |
@cache = [0,1] def fib(n) return @cache[n] if @cache[n] @cache[n] = fib(n-1) + fib(n-2) end |
First we check to see if the result is already in the cache, if it is then return it, otherwise we do the calculation and save the result.
This will run a lot faster and it will be able to calculate much bigger Fibonacci numbers.
The Limits of Recursion
As a reader kindly pointed out, the recursive solution can fail with SystemStackError: stack level too deep with big input numbers (around 7500, exact number depends on your system). If you need to calculate an even bigger number you would have to use an iterative solution.
|
1 2 3 4 5 |
memo = [] (0..n).each do |i| memo[i] = i < 2 ? i : memo[i-1] + memo[i-2] end |
Conclusion
Recursion is great but sometimes it can be hard to grasp. Now it’s your turn, practice makes mastery! Please share this post if you like it
Static Analysis in Ruby
If you want to know something about your source code, like the name and line number of all your methods, what do you do?
Your first idea might be to write a regexp for it, but what if I told you there is a better way?

Static analysis is a technique you can use when you need to extract information from the source code itself. This is done by converting source code into tokens (parsing). Let’s get right into it!
Using the Parser Gem
Ruby has a parser available on the standard library, the name is Ripper. The output is hard to work with so I prefer using the fantastic parser gem. Rubocop uses this gem to do its magic.
This gem also includes a binary you can use to parse some code directly and see the resulting parse tree.
Here is an example:
|
1 |
ruby-parse -e '%w(hello world).map { |c| c.upcase }' |
The output looks like this:
|
1 2 3 4 5 6 7 8 9 |
(block (send (array (str "hello") (str "world")) :map) (args (arg :c)) (send (lvar :c) :upcase)) |
This can be useful if you are trying to understand how Ruby parses some code. But if you want to create your own analysis tools you will have to read the source file, parse it and then traverse the generated tree.
Example:
|
1 2 3 4 |
require 'parser/current' code = File.read('app.rb') parsed_code = Parser::CurrentRuby.parse(code) |
The parser will return an AST (Abstract Syntax Tree) of your code. Don’t get too intimidated by the name, it’s simpler than it sounds
Traversing the AST
Now that you have parsed your code using the parser gem you need to traverse the resulting AST.
To do that you need to create a class and inherit from AST::Processor:
|
1 2 |
class Processor < AST::Processor end |
Then you have to instantiate this class and call the .process method:
|
1 2 |
ast = Processor.new ast.process(parsed_code) |
You need to define some on_ methods. These methods correspond to the node names in the AST.
To discover what methods you need to define you can add the handler_missing method to your Processor class. You also need the on_begin method.
|
1 2 3 4 5 6 7 8 9 |
class Processor < AST::Processor def on_begin(node) node.children.each { |c| process(c) } end def handler_missing(node) puts "missing #{node.type}" end end |
Here is where we are:
You have your AST and a basic processor, when you run this code you will see the node types for your AST.
Now:
You need to to implement all the on_ methods that you want to use. For example, if I want all the instance method names along with their line numbers I can do this:
|
1 2 3 4 5 6 |
def on_def(node) line_num = node.loc.line method_name = node.children[0] puts "Found #{method_name} at line #{line_num}" end |
When you run your program now it should print all the method names found.
Conclusion
Building a Ruby static analysis tool is not as difficult as it may look. If you want a more complete example take a look at my class_indexer gem. Now it’s your turn to make your own tools!
Please share this post if you enjoyed it!
Debugging your Ruby Programs
How often does your program do exactly what you want the first time around? Many times our programs won’t work like you expect, so we have to use the art of debugging ruby to help us finding out why.
You may be familiar with the following error message:
|
1 |
undefined method 'some_method' for nil:NilClass |
As you know, this means that a nil value managed to find it’s way into our code. Using the techniques discussed in this article you will learn how to deal with this issue and similar problems.
Understanding Errors & Stack Traces
When you are getting an error from the Ruby interpreter or your program is not doing what it should be doing then it’s time to put on your debugging hat.
If the problem is that your program is crashing, it is important to pay attention to the error message, which usually will contain clues of what’s going wrong.
Here is an example:
|
1 2 3 4 5 6 7 8 9 |
def method1 method2 end def method2 puts invalid_variable end method1 |
Running this code will give you the following error:
|
1 2 3 |
/tmp/stack.rb:6:in 'method2': undefined local variable or method 'invalid_variable' for main:Object (NameError) from /tmp/stack.rb:2:in 'method1' from /tmp/stack.rb:9:in '<main>' |
This is what is known as a stack trace. Let’s analyze it together!
We start with the line on the top. This is where the actual error occurred, but it doesn’t mean the error condition originated here. However, it is still a good point to start our investigation.
Here’s the deal:
| Text | Description |
|---|---|
| /tmp/stack.rb:6 | File and line number |
| in `method2‘ | Method name |
| undefined local variable or method ‘invalid_variable‘ | Error message |
| main:Object | Class name |
| (NameError) | Exception name |
As you can see the error is not that intimidating when broken down in this way. By the way, you can find a list of exceptions here.
Now:
Every line in the stack trace below the first one tells you how the code got here. It’s basically a method chain, if you keep going down you should eventually find the main method of your app.
Here is a general algorithm for dealing with a stack trace:
- Read the top line of the stack trace
- If the file is part of your project: open the faulting file on the indicated line number. If it isn’t, keep going down the stack trace until you find the first reference to a file you recognize
- See if anything obvious jumps out to you and fix it (look for things mentioned on the error message)
- If that doesn’t help then you will need to find more information, like the values of the affected variables.
Debugging Ruby
The most basic (which doesn’t necessarily mean bad) debugging technique that you are probably familiar with is just dumping the values of the suspected variables.
In Ruby you can do that using puts or p. Using p is equivalent to saying puts variable.inspect, and it’s useful for looking at objects.
Example:
|
1 2 3 4 5 6 7 8 9 10 11 12 13 14 15 16 |
Book = Struct.new(:title) def find_book(title) books = [] books << Book.new('Eloquent Ruby') books.find { |b| b.title == title } end book = find_book('Eloquent Ruby') p book # This will print our book object book = find_book('POODR') p book # This will print nil book.name # Guess what happens next :) |
Digging Deeper with Pry
When you have many variables to check, adding puts everywhere might not be very practical. In that case you should try pry.
Using pry you can make your code stop at a specific line of code (also known as a breakpoint) and it will drop you into an irb-like environment, where you can evaluate ruby code in the context of your project, or execute one of the many useful pry commands.
Using pry is really easy:
All you have to do is drop binding.pry where you would like to install a pry breakpoint. You will also need to require pry into your project (require ‘pry’).
If you just want to do it temporarily then you can call your ruby script like this:
|
1 |
ruby -rpry app.rb |
That won’t be very helpful for a rails app, so you may want to add pry to your Gemfile. What I like to do is to have a macro/snippet on my editor that already includes the require in the same line than the breakpoint, so when I delete it I will be deleting both things.
This is what you will see when you are dropped on a pry session:
If you want to completely quit a pry session you can type exit!, if you do a regular exit it runs your program until the next breakpoint.
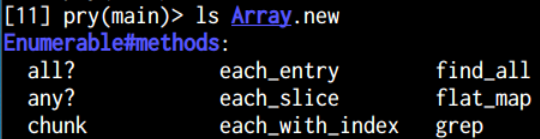
The power of pry doesn’t end here. For example, you can use the ls command to see what methods and instance variables an object has access to.
Don’t forget to run the help command to get a listing of all the goodies!
Another Ruby Debugger: Byebug
Byebug can act as a pry replacement or as a gdb-like debugger for Ruby. If you want to use it for the former then you just drop byebug instead of binding.pry where you want your code to stop. One of the cons of using Byebug over pry is that it doesn’t provide syntax highlighting.
Let’s see how you can set breakpoints and debug you code inside byebug!
Usually you would call the help command, but in this case it is lacking a bit on information:

So you will have to consult the documentation. We can see how using the command break and a line number we can set our breakpoints. To get a list of breakpoints you can use info breakpoint.
Once your breakpoints are set, you can move through the program execution using the following commands:
- step (advance one instruction, stepping into method calls)
- next (advance one instruction, doesn’t get inside methods)
- continue (run until the end or next breakpoint)
If you type enter without any command it with just repeat the last one, this is very useful when walking through your code.
When All Else Fails
Make sure to take a break when you have put a good amount of time in and can’t see the solution, when you come back with fresh eyes you will realize the solution was in front of you. You can also try explaining the problem to someone else.
Some times you are not sure where the problem is, when this happens you still have plenty of options. For example, you may want to comment blocks of code to try and isolate the issue. If the issue disappears then you can uncomment a portion of the code that you just commented. This is a very low-tech solution, but it might be exactly what you need in certain situations.
If you got this far and nothing seems to help:
It’s time to pull out the big guns. Here are some system tools that you will often find to be helpful.
One of these tools is Wireshark, which will let you inspect network traffic. If you are dealing with SSL-encrypted traffic a mitm (Man in the middle) proxy like mitmproxy might be able to help you.
You can also try curl to initiate HTTP connections from your terminal, which may help you debug invalid server responses.
Another tool that is useful to be familiar with is strace (linux only), this tool will show you all the system calls that your app is doing. You can filter for specific system calls using the -e option. A more modern alternative to strace is sysdig.
Warning! You may want to avoid using strace in production since it severely degrades the performance of the system under test.
Finally, if you are dealing with an issue that looks like it’s coming from some external gem, an obvious step is to inspect the gem’s source code. You can use the gem open
Conclusion
Even if debugging isn’t the most fun activity ever, there are plenty of tools and techniques that can make it easier for you, use them to help you.
Please share this post if you enjoyed it so more ppl can learn! 😉
Using Ruby Threads
Using ruby threads you can make your applications do multiple things at the same time, making them faster.
In MRI (Matz’s Ruby Interpreter) you will only benefit from threads in i/o bound applications. This limitation exists because of the GIL (Global Interpreter Lock), alternative Ruby interpreters like JRbuy or Rubinius can take full advantage of multi-threading.

So, what are threads? You can think of them as units of execution or workers. Every process has at least one thread and you can create more on demand.
I/O bound applications
An i/o bound app is one that needs to wait for an external resource: a network connection, a disk read, etc. A thread can decide to stop while it waits for this resource to be available, this means that another thread can run and do its thing and not waste time waiting.
One example of an i/o bound app is a web crawler. For every requests the crawler does it has to wait for the server to respond, and it can’t do anything while waiting. But if you are using threads, you could make 4 request at a time and handle the responses as they come back, which will let you fetch pages faster. Sounds interesting? Let’s get started!
Creating Ruby Threads
To create a new thread we call Thread.new, and pass in a block with the code that will be executed in that thread.
|
1 |
Thread.new { puts "hello from thread" } |
Pretty easy, right? However, if you have the following code you will notice that there is no output from the thread:
|
1 2 |
t = Thread.new { puts 10**10 } puts "hello" |
The problem is that Ruby doesn’t wait for threads to finish. You need to call the .join method on your thread to fix the code above:
|
1 2 3 |
t = Thread.new { puts 10**10 } puts "hello" t.join |
During your exploration of ruby threads you may find the documentation useful: http://ruby-doc.org/core-2.1.0/Thread.html
Threads and Exceptions
If an exception happens inside a thread it will die silently without stopping your program or showing any kind of error message. Here is an example:
|
1 |
Thread.new { raise 'hell' } |
For debugging purposes, you may want your program to stop when something bad happens. To do that you can set the following flag on Thread to true:
|
1 |
Thread.abort_on_exception = true |
Thread Pools
Let’s say you have hundreds of items to process, starting a thread for each of them is going to destroy your system resources. It would look something like this:
|
1 2 3 4 5 |
pages_to_crawl = %w( index about contact ... ) pages_to_crawl.each do |page| Thread.new { puts page } end |
If you do this you would be launching hundreds of connections against the server, so that’s probably not a good idea. One solution is to use a thread pool.
Thread pools allow you to control the number of active threads at any given time.
You could build your own pool, but I wouldn’t recommend it. In the following example we are using the celluloid gem to do this for us.
|
1 2 3 4 5 6 7 8 9 10 11 12 13 14 15 16 17 |
require 'celluloid' class Worker include Celluloid def process_page(url) puts url end end pages_to_crawl = %w( index about contact products ... ) worker_pool = Worker.pool(size: 5) # If you need to collect the return values check out 'futures' pages_to_crawl.each do |page| worker_pool.process_page(page) end |
This time only 5 threads will be running, and as they finish they will pick the next item.
Race Conditions and Other Hazards
This may sound all very cool but before you go out sprinkling threads all over your code you must know that there are some problems associated with concurrent code.
For example, threads are prone to race conditions. A race condition is when things happen out of order and make a mess. Another problem that can happen is a deadlock, this is when one thread holds exclusive access (using a locking system like a mutex) to some resource and never releases it, which makes it inaccessible to all the other threads.
To avoid these issues, it’s best to avoid raw threads and stick with some gem that already takes care of the details for you.
More Threading gems
We already used celluloid for our thread pool, but there are many other concurrency-focused gems that you should check out:
https://celluloid.io/
https://rubygems.org/gems/thread
https://github.com/grosser/parallel
https://github.com/chadrem/workers
https://github.com/ruby-concurrency/concurrent-ruby
Ok that’s it, hopefully you learned a thing or two about ruby threads! If you found this article useful please share it with your friends so they can learn too