Tag Archives for " troubleshooting "
Performance analysis with perf
Is Apache or some other process using most of your CPU but you have no idea why? I have the solution for you! Linux has some low-level troubleshooting tools that will let you investigate the issue and find out what’s going on. One of those tools is strace, which will capture all the system calls made by one process.
A problem with strace is that it can only work with one process at a time, so for a multi-process program like Apache this isn’t going to be that useful. In addition, system calls don’t tell us the whole story of what’s happening inside a process. This is why we are going to talk about a tool called perf.
Using perf
If you don’t have perf installed you can install it from the linux-tools package. Once we are ready to start with our little troubleshooting adventure we can start with perf’s record mode.
|
1 |
perf record -F 99 -u www-data |
Notice how we passed in the -u option, to tell perf to only record events from the apache user, this is a great way to filter many events that we may not be interested in. Let perf run while the high cpu issue is happening, you can stop it with a CTRL+C once you think you got enough data. The next step is to run perf’s report mode so we can see the output.
|
1 |
perf report |
This will take up all our terminal space to show us the results:
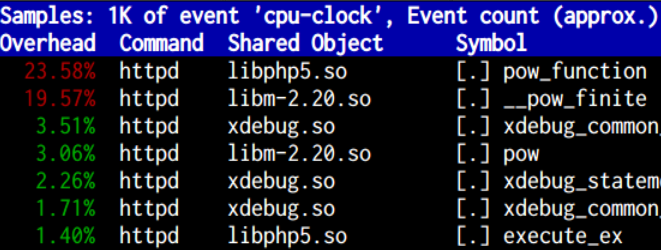
The solution
Well if you pay attention this is quite revealing! In the ‘shared object’ column, you can see a lot of ‘libphp5.so’ entries. In fact the top entry in the list is like that, so we can make a good guess that this issue is coming from a php script. If we take a look at our apache error log we find the following, which confirms our suspicion.
/var/log/httpd/error_log:[Mon Feb 16 04:49:08.793848 2015] [:error] [pid 10504] [client 127.0.0.1:47356] PHP Fatal error: Maximum execution time of 20 seconds exceeded in /srv/http/slow.php on line 6
In this case, the culprit code was this:
|
1 2 3 4 5 6 7 |
<?php $TIMES = 100000000; for ($i = 0; $i < $TIMES; $i++) { echo $i ** $i; } |
Learn more
Perf also has other modes of operation, for example use perf trace for system-wide strace output. Run perf help to get the full list of everything it can do for you.
https://perf.wiki.kernel.org/index.php/Tutorial#Sampling_with_perf_record
http://www.slideshare.net/brendangregg/scale2015-linux-perfprofiling
You might also like:
Troubleshooting with lsof
Troubleshooting with lsof
Lsof is a standard Linux utility that can help you troubleshoot a range of issues related to open files. If you run it without any options it will display ALL the open files in the system, which might be a bit overwhelming.
Fortunately you can use the -p <pid> option to see all the files opened by a specific process. Another useful way to call lsof is by passing in a file name as argument, this way lsof will show you the process that has this file open.
Using lsof, an example
Have you ever been in a situation were you couldn’t do something because you got a “Resource temporarily unavailable” error or something like that? Well this is the kind of thing lsof can help you with. Let’s see an example: